Memory leak
A bug where a program keeps grabbing memory and never gives it back.
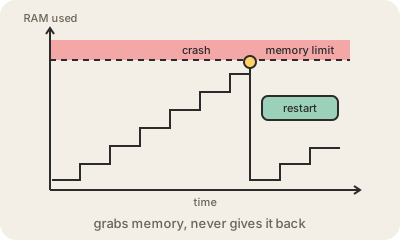
A memory leak happens when a program reserves memory (RAM) for something, stops needing it, but never releases it. Each leak may be tiny, but if it happens every time a user clicks, a request arrives or a loop runs, the program's memory use climbs steadily. Eventually the computer slows down as it starts swapping to disk, or the operating system kills the program for using too much.
In languages like C and C++, programmers reserve and release memory by hand, so forgetting the release is the classic leak. Languages like Java, Python and JavaScript have a garbage collector that frees memory automatically once nothing refers to it anymore, but leaks still happen: a list or cache that only ever grows, an event listener that is never removed, or an object kept alive by one forgotten reference. The garbage collector cannot free what the program still seems to be holding.
The telltale sign is a memory graph that rises like a staircase and never comes down, and a problem that goes away after a restart, only to come back hours or days later. That is why "have you tried turning it off and on again" so often works, and why some services are restarted on a schedule as a stopgap. The real fix is finding the leak with a memory profiler, a tool that shows what is taking up the space and who is holding on to it.
Keep in mind
- Memory that is reserved and no longer needed, but never released.
- Memory use grows steadily until the app slows down or crashes.
- Garbage-collected languages still leak through forgotten references.
- A restart hides it temporarily; a memory profiler finds the cause.