Dashboard
One screen of charts and numbers that shows how something is doing at a glance.
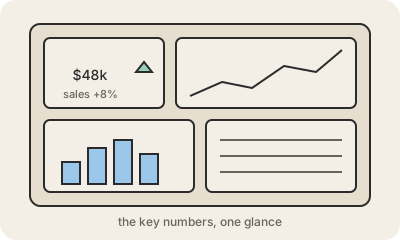
A dashboard is a single page that gathers the most important numbers and charts about something, a business, a website, a hospital ward, and keeps them up to date. Instead of opening ten reports, you look at one screen and see sales this week, how many orders are late and whether the trend is going up or down.
Most dashboards are built from a few kinds of tiles: a big number for a key figure (with a comparison like "+8% vs last month"), line charts for trends over time, bar charts to compare categories, and small tables for details. Filters let you narrow it to one region, one product or one date range. Tools like Power BI, Tableau, Looker Studio or Grafana connect to the data and refresh the tiles automatically.
A good dashboard answers a specific group's recurring questions and fits on one screen. A bad one tries to show everything and ends up showing nothing. The numbers are only as trustworthy as the data and definitions behind them, which is why dashboards usually sit on top of a data warehouse that someone keeps clean.
Keep in mind
- One screen with the key numbers and charts about something.
- Built from tiles: big numbers, trend lines, bar charts, small tables.
- Updates automatically from the underlying data.
- Best when designed for a specific audience and its questions.