A/B testing
Showing two versions to two random groups and measuring which one works better.
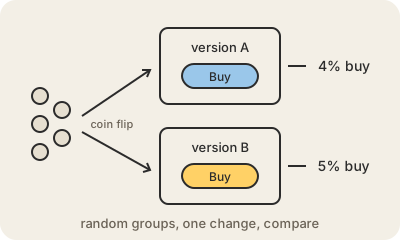
A/B testing is a simple experiment: you take two versions of something, A (the current one) and B (the change), and show each to a different group of people chosen at random. Then you compare a number that matters, like how many people sign up, click or buy. If B clearly does better, you keep B.
The random split is the key. Because chance decides who sees which version, the two groups are alike in every other way: same mix of new and old customers, phones and computers, weekdays and weekends. So if the results differ, the change itself is the most likely reason. That is what makes an A/B test stronger than comparing "before and after", where a holiday or a news story could explain the difference.
Websites and apps run thousands of these: button colors, prices, email subject lines, the order of search results. The common mistakes are stopping the test as soon as it looks good, running it on too few people, or checking twenty numbers until one of them looks like a win. A small difference only counts when it is larger than what chance alone would produce, which is what statistical significance measures.
Keep in mind
- Two versions, two random groups, one number to compare.
- Random assignment is what lets you say the change caused the difference.
- Needs enough people and a fixed end date to be trustworthy.
- Used everywhere online: designs, prices, emails, recommendations.