Business intelligence
Turning a company's data into reports and dashboards people use to decide.
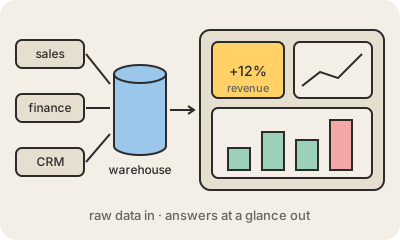
Business intelligence, or BI, is the set of tools and practices that turn a company's raw data into reports, charts and dashboards that people can read without writing code. A sales manager opens a page on Monday and sees revenue by region, this month against last, and which products are falling behind. That page is BI.
Behind the dashboard there is usually a pipeline. Data from the systems a company runs on, like sales, billing, the CRM and the website, is copied by ETL processes into a data warehouse, cleaned and organized into tables with agreed definitions. BI tools such as Power BI, Tableau, Looker or Amazon QuickSight connect to that warehouse, run SQL behind the scenes and draw the results as charts that update on their own.
The hard part is rarely the charts. It is agreeing on what the numbers mean: does "active customer" mean bought this month or logged in this year? Good BI teams define these KPIs, key performance indicators, once and reuse them everywhere, so two departments do not arrive at a meeting with different totals. BI mostly answers "what happened and where?"; predicting what will happen next is usually the job of data science.
Keep in mind
- Reports and dashboards that let non-technical people explore data.
- Usually built on top of a data warehouse fed by ETL.
- Shared definitions of each KPI matter more than pretty charts.
- Describes what happened; prediction is closer to data science.