Amazon CloudWatch
The dashboard and alarm system that watches everything running in your AWS account.
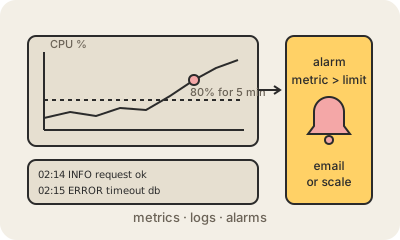
CloudWatch is the AWS service for monitoring. Almost every AWS service reports metrics to it on its own: CPU use of an Amazon EC2 instance, number of calls to an AWS Lambda function, free space in an Amazon RDS database, messages waiting in a queue. You see them as charts going back months, without installing anything.
Second piece: logs. Applications and services send their text output to CloudWatch Logs, where you can search it ('every line with error in the last hour') instead of logging into machines. Third piece: alarms. You write a rule such as 'CPU above 80% for five minutes' or 'more than ten errors a minute', and CloudWatch sends an email through Amazon SNS, pages the on-call person, or triggers an action like adding servers.
Why it matters: in the cloud you cannot walk over to a machine and look at it. CloudWatch is how you find out something broke, ideally before the users do. A team sets an alarm on a Lambda function's error count; at 2 a.m. it fires, the on-call engineer gets a text, and the fix goes in before the morning rush.
Keep in mind
- Metrics are numbers over time, logs are text, alarms act on either.
- Most AWS services send basic metrics for free; detailed metrics and logs cost per gigabyte.
- Alarms can notify people or trigger automatic actions like scaling.
- Dashboards put metrics from many services on one screen.