Time series
A list of measurements of the same thing, taken one after another in time.
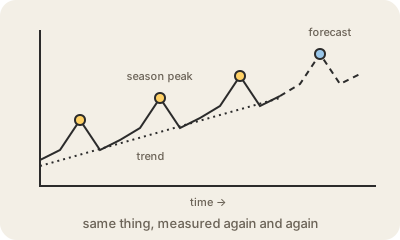
A time series is a sequence of values of the same quantity recorded at successive moments: the temperature every hour, a stock price every second, a website's visits per day, a server's CPU use every ten seconds. What makes it special is that the order matters. Each point only makes sense next to the ones before and after it.
Analysts look for a few typical shapes in a time series. The trend is the long-term direction (slowly going up). Seasonality is a pattern that repeats on a calendar (more ice cream sold every summer, more traffic every Monday morning). And then there is noise: the random wiggle left over. Separating these is the basis of forecasting, from predicting next month's sales to planning how many servers a holiday will need.
Because this kind of data arrives constantly and is almost always read by time range, there are databases built just for it, called time-series databases, like InfluxDB, TimescaleDB or Amazon Timestream. They compress the data well and make questions like "average per minute over the last 24 hours" very fast. Monitoring tools for servers and IoT devices are built on top of them.
Keep in mind
- Values of one thing measured in time order; the order carries the meaning.
- Trend, seasonality and noise are the three parts analysts try to separate.
- The basis of forecasting: sales, demand, traffic, energy use.
- Time-series databases store this kind of data and query it by time range quickly.