Outlier
A value that sits far away from the rest of the data.
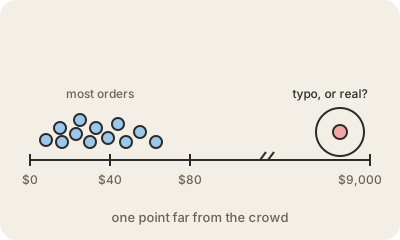
An outlier is a data point that is very different from the others. If a shop's orders are usually between 20 and 60 dollars and one order is for 9,000, that order is an outlier. In a chart, it is the lonely dot far away from the crowd.
Outliers have two very different origins, and telling them apart is the real work. Some are mistakes: someone typed 9000 instead of 90.00, a sensor glitched, a test order was left in. Those should be fixed or removed. Others are real and often the most interesting thing in the data: a large company buying in bulk, a fraud attempt, a server about to fail. Deleting those would hide exactly what you needed to see.
They matter because some summaries are very sensitive to them. One billionaire walking into a bar makes the average income of the room enormous, while the median (the value in the middle) barely moves. That is why analysts look at the data before averaging it, and why reports on incomes or house prices usually give the median. Detecting unusual values automatically, called anomaly detection, is used in fraud prevention, security and equipment monitoring.
Keep in mind
- A value far from the rest, for good or bad reasons.
- Could be an error to fix or a real, important event like fraud.
- Distorts averages a lot; the median is much more robust.
- Never delete one without first asking why it is there.