Star schema
A data warehouse layout: one table of events in the middle, descriptive tables around it.
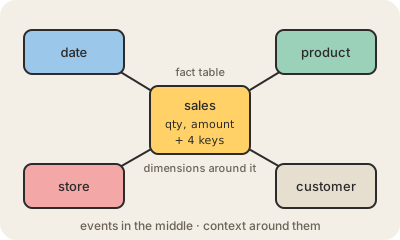
A star schema is the most common way to organize tables in a data warehouse for analysis. In the center sits a fact table: one row per event you want to measure, such as each sale, with numbers like quantity and amount plus keys pointing outward. Around it sit dimension tables that describe the context of those events: date, product, store, customer. Drawn on a whiteboard, the center and its spokes look like a star.
The design matches how people ask business questions: "sales amount (the fact) by month and region (the dimensions)". A query joins the fact table to the dimensions it needs, filters and groups, and that is all. BI tools like Power BI are built around this shape, and it is the core of dimensional modeling, the method popularized by Ralph Kimball in the 1990s.
Unlike a normalized transactional database, a star schema deliberately repeats data in the dimensions, for example storing category and brand right on each product row, to keep joins few and shallow. Fact tables can grow to billions of rows while dimensions stay comparatively small. When dimensions are themselves split into further normalized tables, the result is called a snowflake schema, which saves space but adds joins.
Keep in mind
- Fact table in the center: measurable events like sales, with numbers and keys.
- Dimension tables around it: who, what, where, when.
- Repeats data in dimensions on purpose to keep queries simple and fast.
- The standard layout behind most data warehouses and BI models.